Unemployment is the unused supply of labour in the labour force. The unemployment rate measures unemployment and is expressed as a percentage of the total labour force, which is the total number of people who are 15 years of age and over who are either employed or unemployed. The unemployment rate is calculated by dividing the number of unemployed people by the number of people in the labour force. The unemployment rate is considered an economic indicator, an economic statistic that is used to interpret or understand the health of an economy. There are several types of unemployment and their causes are often debated by economists. The unemployed are not a fixed collection of individuals but an ever-changing group, most of whom might be unemployed only briefly.
Employment and Unemployment
Statistics Canada defines unemployed persons as those who were available for work during the survey reference week (when labour force statistics are collected), but: were without work and had looked for work in the past four weeks; were on temporary layoff due to business conditions and expected to return to work; were waiting for a new job to begin within four weeks.
Employed persons are defined by Statistics Canada as those who did any paid work at a job or business during the survey reference week, either as an employee or under self-employment. Employed persons are also those who did unpaid family work, which is defined as “unpaid work contributing directly to the operation of a farm, business or professional practice owned and operated by a related member of the same household.” The employed have jobs, although some may be temporarily absent from work because of illness, strikes, bad weather, vacation, etc.
A third category includes individuals who are not in the labour force and are not considered employed or unemployed. This includes individuals who are not able to work or are unavailable for work, as well as individuals who are without work and have neither looked for work or are expecting to work. Full-time students in school are not considered to be part of the labour supply, for example, neither are retired persons.
Unemployment Rate
The unemployment rate measures unemployment and is expressed as a percentage of the total labour force. The labour force is the total number of people who are 15 years of age and over who are either employed or unemployed. The unemployment rate is calculated by dividing the number of unemployed people by the number of people in the labour force.
The unemployment rate is considered an economic indicator, an economic statistic that is used to interpret or understand the health of an economy.
Measuring Unemployment
The official Canadian statistics on unemployment come from the monthly Labour Force Survey of Statistics Canada, a sample survey of some 56,000 representative households in all provinces and territories, accounting for approximately 100,000 people. First Nations reserves and settlements, the Armed Forces and residents of institutions, such as prisons, hospitals, or nursing homes, are not covered.
History of Unemployment in Canada
Unemployment has risen on average since the mid-1960s, both in absolute numbers and as a percentage of the labour force (unemployment rate). Annual average unemployment rates of 3 to 5 per cent were common before 1958 and from 1964 to 1969. From 1958 to 1963 and in the early 1970s, 5 to 7 per cent rates prevailed.
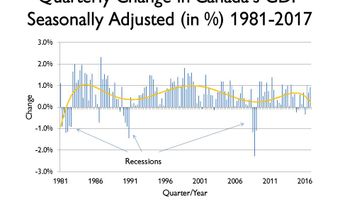
Over most of the post-1975 period, employment also grew, but the labour force grew even more rapidly so that the number and fraction that were unemployed rose. During the recession of the early 1980s (June 1981 to October 1982), the unemployment rate jumped. In August 1981, employment declined, as did labour-force participation and the fraction of the working-age population that was employed (those 15 years of age and over). The unemployment rate rose steadily over the period to December 1982, reaching 13.1 per cent. This was thought to be the highest rate of unemployment since the Great Depression, when the unemployment rate peaked at 19.3 per cent in June 1933. The unemployment rate was gradually reduced to about 7 per cent in the late 1980s, but rose sharply again during the recession of the early 1990s, peaking at 12.1 per cent in November 1992.
After the recession of the early 1990s (March 1990 to April 1992), employment recovered slowly, and, as a result, a drop in the unemployment rate was delayed until 1994. Strong employment growth from 1997 to 2000 brought the unemployment rate down to 6.8 per cent in January 1999. Unemployment spiked again briefly in the early 2000s, before resuming its decline in September 2003.
The rate fell to 5.8 per cent in October 2007, its lowest rate before the 2008–09 recession. During the recession, the unemployment rate peaked at 8.7 per cent in June 2009. Employment losses were absorbed in January 2011, when the unemployment rate was 7.7 per cent. Since then, the rate has been on a downward trend, falling to 5.7 per cent in December 2017 — or an annual average of 6.4 per cent for 2017.
On 11 March 2020, the World Health Organization declared Covid-19 a global pandemic. To protect public health, jurisdictions across Canada implemented travel, business and social distancing measures. These measures impacted the Canadian labour market. In May 2020, Canada’s unemployment rate reached 13.7 per cent. This is estimated to be the highest recorded rate of unemployment since comparable data became available in 1976. The labour market gradually recovered and in February 2022 the unemployment rate fell below its pre-Covid-19 level at 5.5%.
Annual Average Unemployment and “Seasonality”
Annual averages for the labour force as a whole conceal large variations within years, between regions and among different groups of people. Regular within-year variation, or “seasonality,” occurs as a result of a periodic influx of certain groups into the labour force, including students during vacation, and of marked seasonal patterns in certain industries (e.g., agriculture, forestry, fishing, construction and tourism), which combine to produce regular seasonal fluctuations in the levels of unemployment and employment. Seasonal patterns for particular regions and demographic groups differ considerably. The numbers or rates are often seasonally adjusted to eliminate these regular fluctuations and to give a clearer picture of other month-to-month changes.
Demographics
Regions and demographic groups — by age or gender, for example — differ also in their typical levels (rates) of unemployment. Traditionally, Quebec and the Atlantic provinces have had higher rates than Ontario and the Prairie provinces. Men have somewhat higher unemployment rates than women in the labour force, a trend since the 1990s. Higher unemployment rates for young people are of long standing.
Women’s unemployment rates were likely lower than those of men in the 1950s and 1960s, but became higher in the 1970s as more women participated more regularly in the labour force. (Exact comparisons of detailed and pre- and post-1975 data are difficult because of substantial revisions in survey methods and definitions.) Some of the increase in overall unemployment rates in the 1970s might be attributable to the increasing number of young people and women in the labour force.
Similar differences in the incidence of unemployment exist between groups classified by occupation, industry, marital and family status, educational attainment and more. Each of these classifications can be subdivided further (as can the age and geographic groupings), and two or more of them can be combined into various cross classifications.
Unemployment and Visible Minorities
As defined by the Employment Equity Act, Statistics Canada defines visible minorities as “persons, other than Aboriginal peoples, who are non-Caucasian in race or non-white in colour.” Though visible minorities in Canada participated in the labour force at a rate higher than non-visible minorities, 9.2 per cent of visible minorities were unemployed in 2016, compared to 7.3 per cent of non-visible minority Canadians. Arab Canadians had an 85 per cent higher unemployment rate (13.5 per cent) and Black Canadians a 71 per cent higher rate (12.5 per cent) than Canadians not classified as visible minorities — gaps in unemployment that were consistent with 2006 census results. In 2016, visible minority women had the highest unemployment rate, at 9.6 per cent. While non-visible minority women had a lower unemployment rate than non-visible minority men, unemployment among visible minority women was higher than among visible minority men (8.8 per cent).
Causes and Types of Unemployment
While specific occurrences of unemployment will, of course, have a multitude of causes, some progress can be made with classifying the general phenomenon according to cause and possible remedy. Spikes in unemployment can be cyclical and are the result of a general decline in production and economic activity (see Business Cycles in Canada). They can be remedied by measures to stimulate the economy to a higher level of performance, although such policies must clearly be influenced by other attendant circumstances (see Fiscal Policy; Monetary Policy).
Frictional Unemployment
Seasonal unemployment is one of the components of frictional unemployment, a result of the normal operation of an economy. Other elements are contributed by the need to search for suitable jobs from time to time even when work is readily available. Thus, even when the economy operates at full capacity, there is always a positive level of frictional unemployment, although there may be offsetting job vacancies. This must be so as long as the detailed composition of economic activity alters, firms start up and go out of business, people change jobs, enter and leave the labour force, move, etc. The unemployed are not a fixed collection of individuals but an ever-changing group, most of whom might be unemployed only briefly.
Structural Unemployment
A second type of unemployment, more likely to be of long duration, is structural unemployment, which is inherent in the structure of the economy itself. This is the result of a mismatching between the skills, location and other characteristics of job seekers and available jobs. Other causes of structural unemployment are technological changes, shifting product demands or a decline in a regional industry, such as the textile industry in the Eastern Townships of Québec or the petroleum industry of the West. It might be remedied by provision of training and retraining, of mobility grants to workers and industries, of public or subsidized employment.
As well as reducing unemployment, it is possible to ease its burden by providing insurance, welfare and other transfer payments or work sharing schemes. Some argued that since, recessions aside, unemployment is chiefly frictional, and prolonged or repeated unemployment is borne chiefly by secondary earners in families, the burden might not be great in any event. But this interpretation is contentious.
Employment Insurance and Minimum Wage
There is some evidence that the “natural” or average level of frictional unemployment increased in the 1960s and 1970s, not only because of demographic changes but also because of changes in social legislation. In particular, the major increases in the generosity of unemployment insurance (now known as employment insurance) in 1971 are said by some critics to have induced higher unemployment. However, there is little consensus on the effects of employment insurance on the unemployment rate.
Some economists have also pointed to higher minimum wages as leading to more difficulty for the relatively unskilled in obtaining both work and on-the-job training. Lack of on-the-job training can make things especially difficult for new entrants to the labour force, particularly the young. Youth unemployment rates have always been higher than the average and it is hardly surprising that initial and early job searches are often more extensive.

 Share on Facebook
 Share on X
 Share by Email
 Share on Google Classroom
